The user interface has been completely updated, making it more consistent and easy to use. This also means that a 64-bit version of the GUI is available, allowing larger dataset plus possible speed improvements.
Ease of use features
It is now possible to display multiple graph windows and MCMC diagnostics windows at the same time, making comparisons easier.
When pasting data with a preview it is now possible to review the whole data being pasted prior to committing.
The facility to define commonly used test structures has been added to the “intervals and tests” window. This basic setup facility allows straightforward testing of the fixed and random parts of the model; this is done without affecting the full flexibility of the procedure. The Intervals and Tests window has also been modified to make it clearer what needs to be input by the user and what is provided the program when results are calculated.
It is now possible to directly call OpenBUGS or WinBUGS, automatically bringing back the parameters chains on completion.
Information regarding the number of higher levels in use for the current model is now displayed on the equations window to alert users to the structure being analysed.
New Windows
A window for setting up 3D graphs has been added
A window for viewing and editing the current content of boxes has been added
A window for viewing and editing the current content of strings has been added
Double-precision columns
Column values in the worksheet are now stored in double precision. This will improve compatibility when saving or loading from
other packages, however there may be slight differences in model results compared to those from previous versions. This is particularly likely to happen where intermediate results are stored on
the worksheet, for example in discrete models or the starting
residuals when running MCMC models.
New default random number generator
The default random number generator has changed from the
3-seed Wichmann-Hill to Mersenne Twister as the former is
considered to have an inadequate cycle length . The old
random number generator is still the default for worksheets
saved in previous MLwiN versions to ensure consistency of
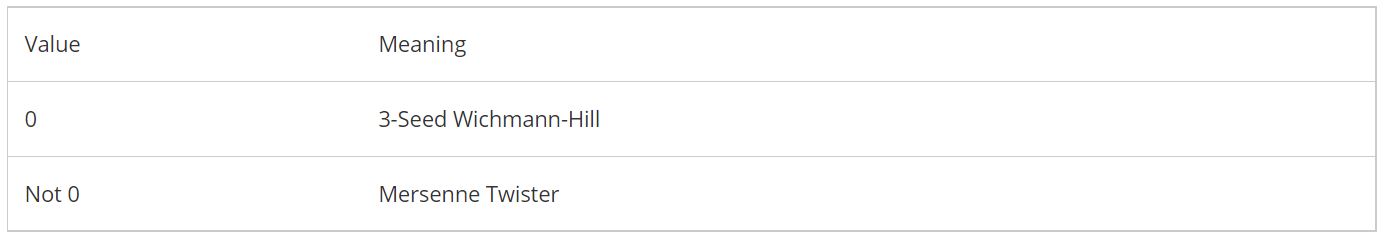
results. The random number generator can be set using the
RNGV command, which has the following values:
MLwiN worksheets with a format corresponding to version three or higher save the current state of the Mersenne Twister random number generator in the worksheet, so results will be consistent between saving and loading the worksheet. If the worksheet is
saved to an older version then this information will be lost and
the generator state will not persist.
Changes to model comparison functionality
When storing model results for MCMC estimation summary
statistics for the chains are now calculated for correlations as
well asvariances and covariances. The values to display can
then bespecified when operating the “Manage stored models
” window. Note,calculating this information requires the parameter chains and so is only available for models stored with MLwiN 3 or later. Thesechanges allow the storing and display of credible intervals for correlations between random effects as well as the covariances when MCMC estimation has been used. As these may
take quite a long time to calculate from the full length of the
chains, the user is kept informed of what is being calculated.
New DTOC command
It is sometimes useful (for example when plotting data by groups) to convert unique values of a continuous variable into discrete categories. The DTOC command will create a new column where each unique values is assigned a category number from zero,
with the original values assigned to the category labels.