

標題搜尋:
⭠ 左右滾動 ⭢

- Grapher 8 地球科學圖形軟體
-
類別地球科學軟體
-
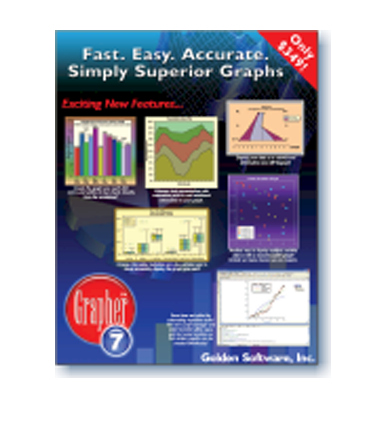
介紹Grapher is a graphing package designed for use by scientists, engineers, and business professionals. If you need to make graphs quickly and easily, Grapher is meant for you! From your data file, use Grapher to create 40 different 2D and 3D graph types.
System Requirements:
- Windows 10, 11 or higher.
- 64-bit operating system.
- 1024 x 768 or higher monitor resolution with minimum 16-bit color depth.
- At least 500 MB free hard disk space.
- At least 512 MB RAM.
Grapher 8 地球科學圖形軟體
Grapher 8 has added a new radar (spider) plot! This exciting new graph has a similar appearance to other radial graphs, except there are multiple radial axes and no angle axis. A radar graph is a graphical method of displaying multiple variables. Comparisons between multiple radar plots typically show trends in your data.
As with every detail in every graph with Grapher, you can change every portion of your plot to fit your own preferences for eye-catching graphics every time!
Create these informative graphs with striking colors to enhance their display! Add text, labels, and color to make your graph more meaningful! Make colors partially transparent to see all your data!
MapViewer 應用地圖繪製軟體
MapViewer is an affordable mapping and spatial analysis tool that allows you to produce publication-quality thematic maps easily. Small businesses, large corporations, independent consultants, scientists, GIS analysts, and numerous government agencies are discovering important trends in their data with MapViewer. Display your data distribution easily and precisely with more easy-to-use features than ever. Your data is unique and you need the best mapping software for the job!
PetraSim 地理介面軟體
PetraSim is the graphical interface for the TOUGH2 family of simulators. Developed at Lawrence Berkeley National Laboratory, TOUGH2 and its derivatives are recognized for their powerful simulation capabilities for fluid flow and heat transfer in porous and fractured media.
Surfer 26 3D地形等高線圖軟體
Surfer contour maps give you full control over all map parameters. You can accept the Surfer intelligent defaults to automatically create a contour map, or double-click a map to easily customize map features.