Faster Performance, More Analytics

» Update Now
@RISK 7.5 offers a range of improvements for any decision maker, from general use enhancements to new, specialized analytical features. New and enhanced graphing options, faster performance, and sophisticated analytics make @RISK 7.5 the only risk analysis tool you’ll need.
» Learn more about What’s New in @RISK 7.5
watchOn-Demand Webinar: What's New in @RISK and DecisionTools Suite 7.5
New and Improved Tornado Graphs
Tornado graphs have long been used to identify the critical variables affecting a risk analysis. Version 7.5 adds a new graph type called Contribution to Variance which shows the amount of the variance in the output attributable to each input variable. In addition, you can now overlay tornado graphs from multiple simulations to compare the effects of model changes. Lastly, we’ve added shading options on the graph bars to indicate whether inputs are high or low when the output increases or decreases.
Faster Optimization with RISKOptimizer
RISKOptimizer, available in @RISK Industrial, is a powerful tool that allows you to optimize linear and nonlinear problems in uncertain situations. It combines optimization with Monte Carlo simulation, and is very computationally intensive. New version 7.5 now runs at least four times faster than previous versions!
Over 20 New @RISK Functions
Sixteen new distribution functions have been added to @RISK, along with six new statistical functions. The new functions are important for accurate, insightful modeling of uncertainty in finance, insurance, reliability, and other applications.
Run Optimizations During Simulation Without Coding
If you need to run Excel Solver during an @RISK simulation, you can now do so without writing any VBA code, saving you time. Version 7.5 makes this easy to set up via dialog box, and it works for Excel Goals Seek and Palisade's Evolver as well.
Graphing and Reporting Improvements
All @RISK graphs and reports now feature an updated, more streamlined interface, as well as support for Excel’s built-in themes and colors. Now you can apply your company’s standard Excel themes to your @RISK reports! In addition, graphical displays have been improved for ultra-high resolution monitors.
And More
You can now control the number of CPUs @RISK uses to run simulations. We’ve also added easy access to @RISK statistics functions in the Model and Summary Results windows, saving you time in modeling.

How @RISK Works
Running an analysis with @RISK involves three simple steps:
1. Set Up Your Model. Start by replacing uncertain values in your spreadsheet with @RISK probability distribution functions, like Normal or Uniform, or dozens of others. These @RISK functions simply represent a range of different possible values that a cell could take instead of limiting it to just one case. Choose your distribution from a graphical gallery, or define distributions using historical data for a given input. Even combine distributions with @RISK’s Compound function. Share specific distribution functions with others using the @RISK Library, or swap out @RISK functions for colleagues who don’t have @RISK.
 See the @RISK distribution palette
Next, select your outputs—the "bottom line" cells whose values interest you. This could be potential profits, ROI, insurance claims payout, disease recovery rate, or anything at all.
Define Uncertainty with Ease
@RISK comes with dozens of distribution functions for defining uncertain variables. These are true Excel functions, behaving the same way as Excel’s native functions and giving you total modeling flexibility. Choosing which @RISK distribution function to use is easy because @RISK comes with a graphical distribution gallery that lets you preview and compare various distributions before selecting them. You can even set up your distributions using percentiles as well as standard parameters, and overlay different distribution graphs for comparison. You can use historical or industry data and @RISK’s integrated data fitting tool BestFit® to select the best distribution function and the right parameters. You can select the type of data to be fit (e.g. continuous. discrete, or cumulative), filter the data, specify distribution types to be fit and specify Chi-Squared binning to be used. Fitted distributions are ranked based on three statistical tests, and may be compared graphically. You can even overlay graphs of multiple fitted distributions. Fit results can be linked to @RISK functions, so the functions will update automatically when input data changes.
Input distributions may be correlated with one another, individually or in a time series. Correlations are quickly defined in matrices that pop up over Excel, and a Correlated Time Series can be added in a single click. A Correlated Time Series is created from a multi-period range that contains a set of similar distributions in each time period.
All @RISK functions and correlations in your model are summarized—with thumbnail graphs—in the dashboard-style @RISK Model window, and you can watch distribution graphs pop up as you browse through cells in your spreadsheet.
Share Your Model with Others
@RISK functions can be stored in the @RISK Library, a SQL database for sharing with other @RISK users. @RISK functions may also be removed with the Function Swap feature, enabling your models be to shared with colleagues who don’t have @RISK installed. @RISK will keep track of any changes that occur in the spreadsheet while the @RISK functions were “swapped out.” You can control how @RISK should update formulas when it finds changes in the model. In addition, you can have @RISK automatically swap out functions when a workbook is saved and closed and automatically swap in if necessary when a workbook is opened.
2. Run the Simulation. Click the Simulate button and watch. @RISK recalculates your spreadsheet model thousands of times. Each time, @RISK samples random values from the @RISK functions you entered, places them in your model, and records the resulting outcome. Explain the process to others by running your simulation in Demo Mode, with graphs and reports updating live as the simulation runs.
See simulation in progress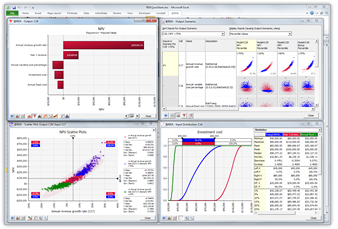
3. Understand Your Risks. The result of a simulation is a look at a whole range of possible outcomes, including the probabilities they will occur. Graph your results with histograms, Scatter Plots, cumulative curves, Box Plots, and more. Identify critical factors with Tornado charts and sensitivity analysis. Paste results into Excel, Word, or PowerPoint, or place them in the @RISK Library for other @RISK users. You can even save results and charts right inside your Excel workbook.
See sampling of @RISK graphsClear, Easy-to-Understand Results
@RISK provides a wide range of graphs for interpreting and presenting your results to others. Histograms and cumulative curves show the probability of different outcomes occurring. Use overlay graphs to compare multiple results, and summary graphs and Box Plots to see risk and trends over time or over ranges. Right-click menus and handy toolbars make navigation a snap. All graphs are fully customizable—including titles, axes, scaling, colors, and more—and ready for export to Excel, Word, or PowerPoint. You can watch results graphs pop up as you browse through cells in your spreadsheet.
@RISK provides you with sensitivity and scenario analyses to determine the critical factors in your models. Use sensitivity analysis to rank the distribution functions in your model according to the impact they have on your outputs. See the results clearly with an easy-to-interpret Tornado diagram, or uncover relationships with Scatter Plots. Sensitivity analysis pre-screens all inputs based on their precedence in formulas to outputs in your model, thus reducing irrelevant data. In addition, you can use @RISK’s Make Input function to select a formula whose value will be treated as an @RISK input for sensitivity analysis. In this way, multiple distributions can be combined into a single input, streamlining your sensitivity reports.
All simulation results for both outputs and inputs are summarized—with thumbnail graphs—in the dashboard-style @RISK Results Summary window. Simulation results may be saved directly in your Excel workbook, and also placed in the @RISK Library to for sharing with other @RISK users.
Excel Ease of Use
@RISK is a true add-in to Microsoft Excel, integrating completely with your spreadsheet. Browse, define, analyze—while never leaving Excel. All @RISK functions are true Excel functions, and behave exactly as native Excel functions do. @RISK windows are all linked directly to cells in your spreadsheet, so changes in one place are carried out in the other. @RISK graphs point to their cells via callout windows. Drag-and-drop ease, context-sensitive right-click menus, and the @RISK toolbar make learning and navigating @RISK a snap.
See the Excel-based interface