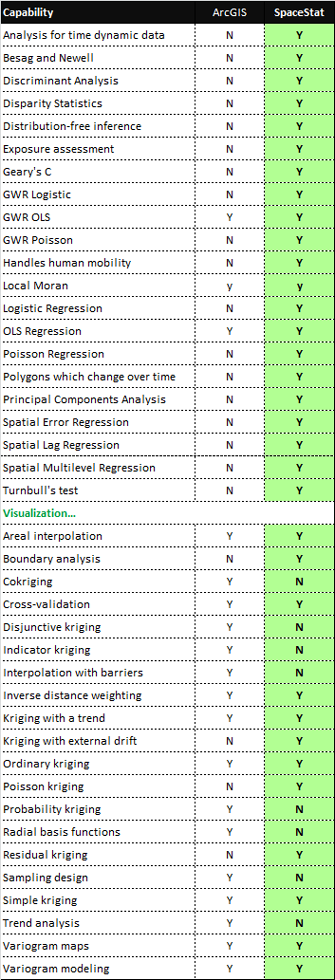
SpaceStat provides an extensive suite of spatiotemporal and statistical tools including: exploratory spatial data analysis; spatial econometric analyses; and the creation of spatial weights sets and variogram models. Use SpaceStat by itself or alongside Esri’s ArcGIS to substantially extend your GIS analysis capabilities.
StaceStat allows you to view the data in your project, display these data in maps and graphs, and to perform statistics to evaluate spatial patterns. What makes this software unique is that it is a space-time information system. In StaceStat, time is a dimension of the data, rather than an attribute linked to each object in the dataset. Thus, almost all views of the data can be animated, from maps to histograms to tables. But, StaceStat does more than just animate your data, it allows you to make statistical inferences about patterns in the data as well. StaceStat allows you to view, interact with and statistically analyze your space-time data so that you can make informed decisions.
Over the past year, we have added powerful new tools for manipulating data and performing statistical analyses, including several which are not available in any other software package. In addition, we have improved data import by adding the option to import geographies or attribute data directly from Microsoft Office Excel files, and made it easy to copy graphs or maps from SpaceStat and paste them into other programs. Here we provide an overview of the features we have availble in SpaceStat.
REGRESSION TOOLS
Although certainly not unique to SpaceStat, aspatial regression tools, including linear, Poisson, and logistic regression allow you to go from spatio-temporal data exploration to model building within one software package. In addition to the “simple” forms of these regression tools, SpaceStat also allows you to use model building tools such as best subset, and forward and backward stepwise regression. All of these tools can be applied to datasets that encompass multiple times, which allows you to quickly evaluate how model fit and other parameters change over time.
In SpaceStat, you can also perform geographically-weighted regression (local, rather than global regression analyses); as with aspatial regression, your GWR models can have a linear, Poisson, or logistic form.
Using SpaceStat, you can not only build both spatial and aspatial models, you can run models developed using one method (i.e., as an aspatial linear model) in another form (i.e., aspatial Poisson, or linear GWR), and use our wealth of data exploration tools to explore how this change in tools influences the results of your analysis over all of the time periods in your datasets.
IMPROVED DISPARITY STATISTICS
Following the publication of advances in quantifying health disparities by Goovaerts et al. (2007), we are the first to make these advances available in a software package.
NEW WAYS TO AGGREGATE DATA/CHANGE YOUR SPATIAL DATA SUPPORT
SpaceStat allows you to aggregate (change the spatial support) for your data in four different ways: from a point or polygon geography to a different point or polygon geography, or from points to polygons and vice versa.
IMPORT DATA AS MICROSOFT OFFICE EXCEL FILES
To simplify the process of importing data, we now provide the option of importing data directly from Microsoft Office Excel. You can use this option to bring in a new point geography, or to add datasets to existing geographies in your SpaceStat project.
COPY GRAPHS, MAPS, AND TABLES TO THE CLIPBOARD
The Map/Graph menus now include an option to copy an image of a given graph or map to the clipboard so that you can paste the image into word processing or presentation (e.g., Microsoft Powerpoint) files open in different software programs. You can perform a similar function with the copy option in the Edit menu for tables, and copy tabular information directly into Microsoft Excel.
SpaceStat Help and Tutorials
We've created extensive Help and Tutorial Pages to guide you through the complex analysis of your data.
ABOUT IMPORTING GEODATABASE FILES INTO SPACESTAT — GDB VERSIONS 10.2 AND LATER
The current version of SpaceStat imports ArcGIS GDB files version 10.1 and earlier. Users of newer versions of ArcGIS should save their geodatabase in GDB version 10.1 by adopting the following strategy (http://desktop.arcgis.com/en/arcmap/10.3/manage-data/geodatabases/create-file-geodatabase.htm#ESRI_SECTION1_4771E57CA5184AB3B296F03C8BB132AC)