UnGraph 數位化繪圖軟體
UnGraph is TWAIN compliant, giving the option to scan images directly from within the software. UnGraph can also directly import images in many formats including TIF, PCX, JPG, BMP and TGA. Images can be panned and zoomed to view and vectorize selected portions. Paint, replace and erase tools allow you to modify images at any time.
UnGraph needs you to enter just three calibrating coordinate values in order to scale your image. The calibration system can make allowance for skewing of images. It also handles logarithmic X- and/or Y-scales of graphs. Calibration data can be saved with an image to facilitate subsequent digitizing sessions.
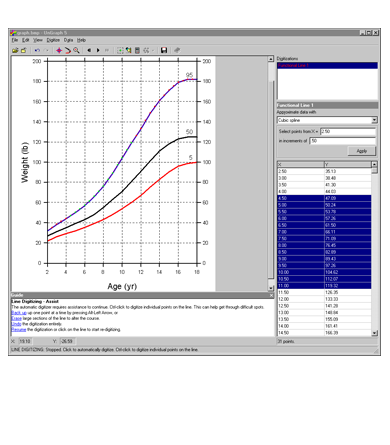
Version 5.0 of UnGraph has an outstanding new user interface with multi-panel screen allowing simultaneous viewing of images, numeric output and, optionally, the context-sensitive Guide which provides continuous hints on how to use the program. Multiple lines can be digitized during a session and color-coding ensures that you know which line corresponds to which dataset. There is an infinite-level Undo and Redo facility.
UnGraph has an extremely powerful automatic line follower (or you can use the mouse to follow a line manually). The line follower can move in either direction in both the X and Y dimension with the result that lines such as map contours or images of cell walls can be digitized. Lines can be of any color and the line-follower will stay on a given color within a user-controlled tolerance range (which allows for color variation in scanned images). To initiate line following you simply position the cursor on the starting point with the mouse and click. UnGraph then invokes its proprietary following algorithm which learns and adjusts to the curve as it goes. The smart gap-jumping and search algorithms follow your line despite imperfections. Settings for the line follower can control its speed and optimize its performance with unusual graph types such as step plots. You can reverse, stepwise, a digitization where the line- follower has inadvertently overshot your desired endpoint.
If you prefer, you can always use manual vectorization for maximum control over digitizing. In this mode, UnGraph allows you to overpaint a selected line and the line-follower then follows the overpaint color.
Multiple lines can be digitized during a session and a color-coding system ensures that you know which line corresponds to which dataset. Images can optionally be saved to include the results of digitizing sessions plus any painting work you have done on them. As well as the automatic line follower there is single-point mode which lets you point and click on any point you wish to digitize. This is suitable for scatter diagrams, histograms and to get height and position coordinates of selected peaks of chromatograms etc.
The X,Y coordinates can be expressed in two forms. By default, the location of every pixel which the line follower passes through is recorded, which allows the program to record sharp changes in line direction better than ever. However the program can also fit a spline model to digitized lines and this gives easy user control over the start value and the intervals between the data output coordinates. The results export module allows numerous formats to be output either as files or via the clipboard. UnGraph optionally lets you format the data output with Header, Body and Footer. This allows for output in specific formats such as XML. Excel (.xls) has been added to the list of output formats in Version 5.0. UnGraph has built-in mathematical functions enabling addition or subtraction of lines and computation of area under the curve (AUC) etc.